
Short answer
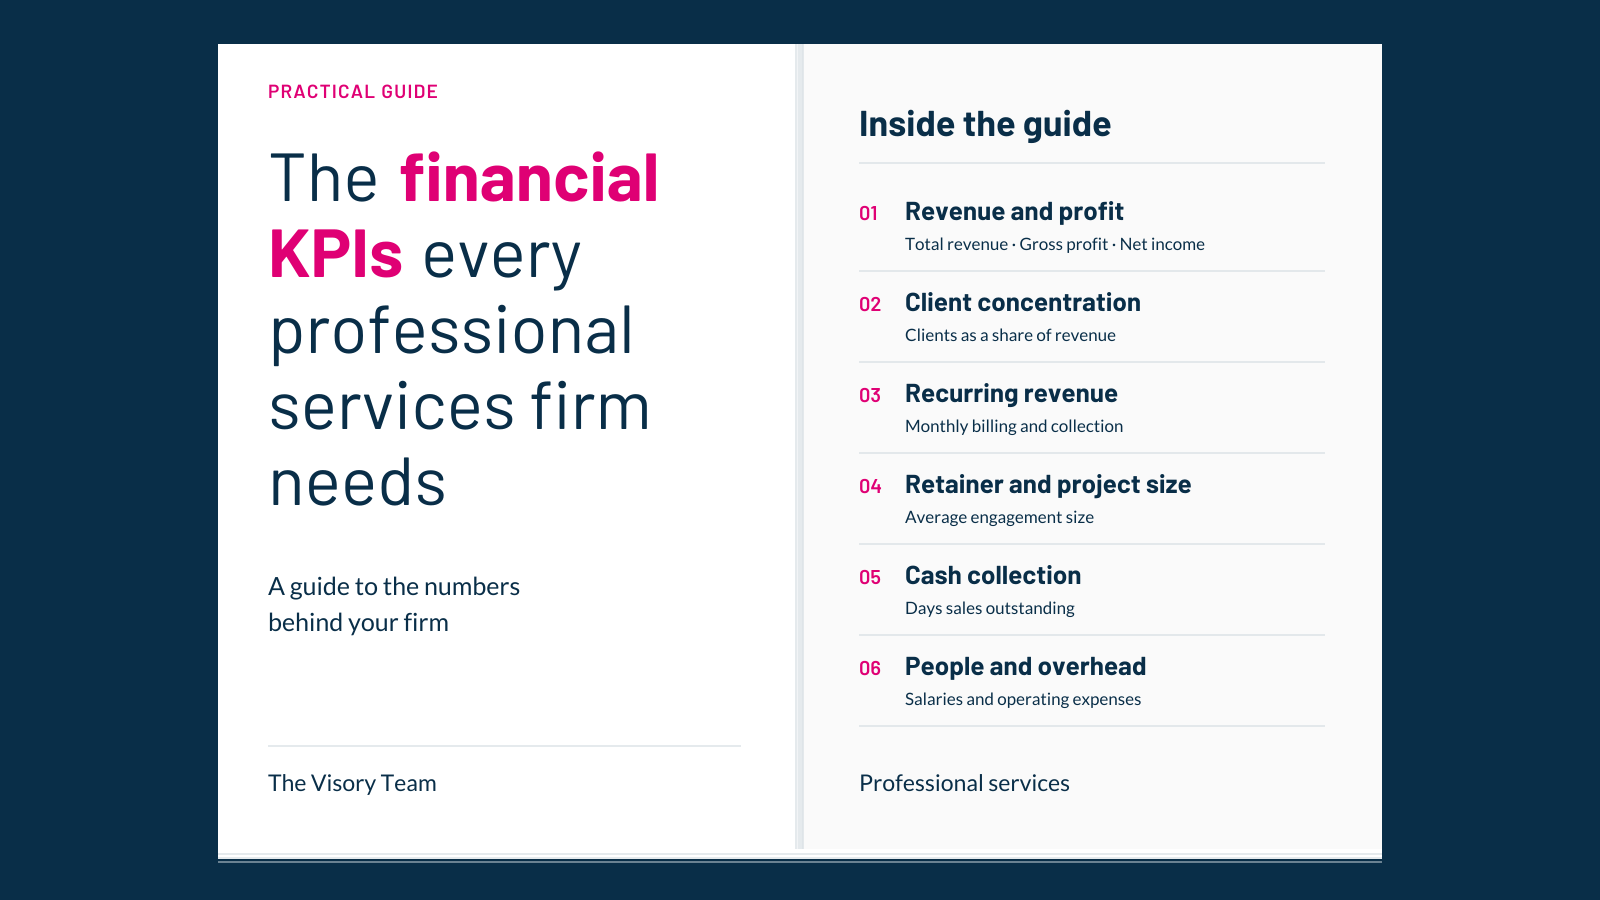
Track a short set of financial KPIs every month: total revenue, gross profit and gross profit margin, net income, each client’s share of revenue, recurring revenue billed and collected, average retainer or project size, the number of clients billed, days sales outstanding, salaries as a share of revenue, and operating expense growth. Read each one as a trend against targets you set for your own firm, because the right level depends on your industry, pricing model, and size.
When an investor approaches you with interest in your company, can you give them detailed insights about the business’s financial health? Or do you say “Oh, we’re growing fast” without any specifics? Be honest. If you don’t have a CFO or you haven’t been analyzing your financial data, you don’t really know how your organization is faring financially.
By establishing key performance indicators (KPIs), you can quantitatively measure your debt-to-income ratio, customer retention, and other important statistics. This allows you to create realistic projections. With a keen understanding of financial health, you will also spot red flags a lot faster and may be able to change course in time to avoid disaster.
Essential KPIs
- Total revenue
- Gross profit
- Net income
- Clients as a % of revenue
- MRR billed in month
- MRR collected in month
- Average retainer or project size
- Number of clients billed in month
- Average AR collection period
- Salaries as a % of revenue
- Operating expense growth
Let’s talk about why your company needs KPIs and how to measure them.

Why businesses need KPIs
Business founders have lofty goals for their companies. But how do you get there? Setting critical success factors and key performance indicators gives you a roadmap.
Critical success factors (CSF) are the activities that are necessary for you to achieve growth and success. These may include generating strong cash flow and increasing profitability. The KPIs of your organization are the tools you use to measure your progress. If your CSF is customer retention, your KPI may be “Renew 90% of retainers due this quarter.”
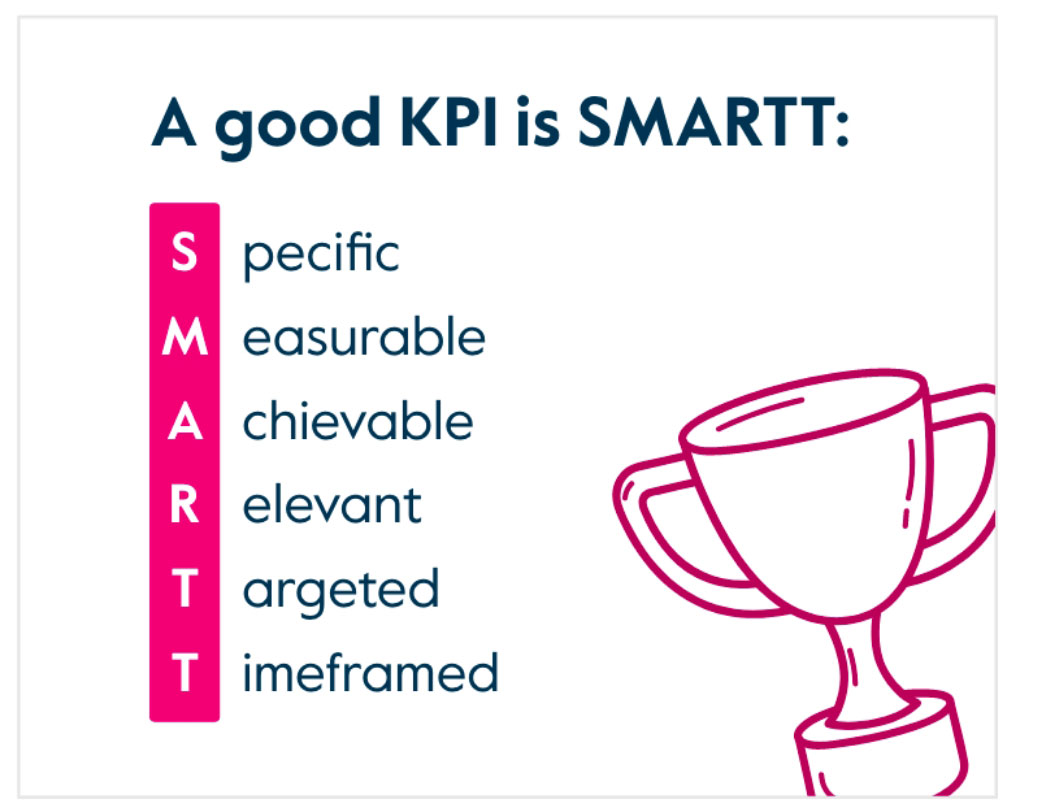
KPIs should be clear and reasonable. But that’s not all. A good KPI is SMARTT: Specific, Measurable, Achievable, Relevant, Targeted, and Timeframed.
Your business needs KPIs to gain insights into the financial trends in your company. They may help you identify areas of struggle where you thought you were doing well. You may realize you can’t scale up as quickly as you thought you could and need to re-evaluate your projections.
Many businesses measure their success against an industry standard, also called a benchmark. Benchmarking can also refer to comparing your KPI measurements against a competitor.
Healthy KPI benchmarks vary by industry. Benchmarks related to customer satisfaction and profitability growth may remain consistent across industries, but realistic goals will depend on the market trends in your field.

Essential KPIs, explained
Here are the most essential key performance indicators for a professional services firm.
Total revenue
The simple formula for measuring revenue is: total number of units sold multiplied by the average price. If you sell 100 units at $2, your revenue is $200. Expenses are then subtracted to determine your company’s net profit for the period being analyzed.
As a KPI, revenue can be measured as:
- Revenue growth month over month (%). The growth of your revenue, month over month, as a percentage increase or decrease. A realistic goal for increasing revenue each month may depend on your industry.
Gross profit
Your company’s gross profit, also called gross income, is equal to the revenue minus the cost of goods sold (COGS). You may also measure your gross profit margin: (revenue − COGS) ÷ revenue. The result is a percentage, which shows how much of each dollar of revenue is left after the direct cost of delivering the work. It is profit before overhead, not the bottom line. For a services firm, the cost of sales is mostly the cost of the people who deliver the work.
A gross profit KPI can be measured as:
- Gross profit month over month (%). The increase or decrease of your gross profit month over month can reveal whether a particular service is trending in the right direction. Aim to increase your gross profit by a modest margin every month to scale realistically.
Net income
Where gross profit measures what remains after the direct cost of delivering your work, net income is the bottom line. Your net income takes your sales figures and subtracts your COGS, taxes, operating expenses, depreciation, and other business costs.
Where your gross profit can reveal if you are maximizing your potential profits, net income reveals if your business’s finances are generally well managed. How profitable are you overall?
Your net income KPI can be quantified as:
- Net income growth month over month (%). If your net income begins to decline, it may indicate inefficient spending or a drop in sales. Steady increases suggest promising future profitability. As with revenue, the KPI goal for net income is usually set as small incremental goals over time.

Clients as a % of revenue
It makes sense for professional services firms to diversify their client base. If one client makes up the majority of your income, could you survive without them? Understanding each client as a percentage of your total revenue helps you identify when you need to add new substantial streams of income.
Each client as a percentage of your revenue can be calculated as:
- Client revenue ÷ total revenue. A higher figure indicates higher customer concentration, which can be a red flag. Depending on your industry and your current client revenue, you may want to set a KPI that reduces concentration by a few percentage points each quarter.
When you track clients as a percentage of revenue, you have more visibility into who contributes to your revenue. You can also trim clients that take up time but don’t contribute to your revenue in any significant way.
Monthly recurring revenue and billings
Monthly recurring revenue (MRR) is the monthly-normalized value of recurring contracts. It helps firms with ongoing retainers track their recurring revenue base. Exclude one-off projects and report their revenue separately.
A $12,000 annual recurring contract contributes $1,000 MRR, regardless of the month it is billed or paid. With 100 active recurring contracts at $100 a month, MRR is $10,000. Track recurring invoices raised separately: billing frequency can make that number different from MRR.
Review changes in MRR by new contracts, expansion, reductions, and cancellations. A lower figure may reflect lost clients or a deliberate change in your client mix; it does not by itself identify the cause.
Cash collected from recurring invoices
Sum actual receipts allocated to the recurring invoices you are reviewing. Do not multiply the number of paid invoices by average revenue per client: clients can pay different amounts, part-pay, or settle older invoices.
For example, two monthly retainers of $100 and $300 have average revenue of $200. If only the $100 invoice is paid, cash collected is $100, not $200. Compare receipts against the same invoice cohort and separately identify opening arrears, credits, and advance payments.

Average retainer or project size
Increasing your retainer amounts improves your cash flow. It’s in most professional services firms’ best interests to measure and grow their retainer income. Likewise, increasing project sizes can warrant higher billables.
As a KPI, it often makes sense to measure retainer income often:
- Retainer or project growth month over month (%). Measuring retainer income and project size month by month lets you identify trends. You can set goals incrementally, such as growing project size by 2% each month.
Some professional services firms operate on a retainer model, some charge a project fee, and some do both.
- Retainer: a recurring monthly or quarterly agreement between a client and a firm for specified services or advice.
- Project: one-off work for a defined period with the client.
If you are operating with a retainer pricing strategy, you want to track the retainer size and its growth over time, especially to keep pace with inflation. When you increase your retainer size, your overall revenue will increase. You need to take on fewer new clients and can instead keep growing revenue efficiently with higher retainer rates for consistent services.
Number of clients billed in month
This KPI is related to your clients as a percentage of revenue. As you steadily increase the number of clients billed each month, you diversify your cash flow sources. You also increase your chances of successful referrals.
Client growth is often measured as a percentage increase between two time periods:
- Client growth month over month (%). KPIs are set as a percentage increase month over month. You may also have a year-end goal for the total number of clients on your roster.
For professional services firms, this one is simple. How many clients are you working with? How has this number changed as you’ve increased your retainer or project fees? Do you need more clients to hit your revenue goals, or can you grow with your existing clients?
Average AR collection period
Professional services firms set a due date for their invoices. Often invoices are due net 30 or net 60, meaning that the total balance must be paid within 30 or 60 days. The shorter your collection period, the more efficiently your accounts receivable runs.
Your average accounts receivable collection period is often referred to as days sales outstanding, or DSO.
KPIs for days to collection are measured in time:
- Number of days to collection. For firms with net 30 terms, the average number of days to collection should be no more than 30. Ideally, you would have a collection period of under 30 days, indicating that your collection efforts work and you are paid early. A reasonable KPI for collection is to aim for all invoices to be paid on time.
For a professional services firm, this metric is primarily a measure of liquidity: it shows how quickly the business turns sales into cash.
The average collection period depends on the terms in your contract with each client and the time allowed to collect a payment, as well as any fees for paying late.
Salaries as a % of revenue
Salaries can take up a significant share of revenue, limiting net profit. Calculating your organization’s salaries as a percentage of revenue is easy: payroll percentage = (total payroll expenses ÷ gross revenue) × 100.
Your KPIs for salaries to revenue are measured as a percentage:
- Salaries to revenue year over year (%). Salaries are measured over longer terms than most other figures. Track the ratio against the same point last year, and set a goal for where you want it to be by this time next year.
The right range varies widely with the firm’s model. A firm that relies heavily on senior talent will carry a higher salary expense; a firm that outsources work or can scale without hiring will carry a lower one. In people-delivered services, salaries are the main cost of delivering the work, so read this ratio alongside your gross margin.
Operating expense growth
Operating expenses range from payroll and office supplies to the rent you pay for your office and the utility bill to keep the lights on. As you expand your company, operating expenses naturally grow. Figuring out how quickly to increase your spending is key.
Creating a realistic budget for your organization hinges on making sure you don’t spend too much too fast.
Operating expense KPIs can be measured by monthly increase goals:
- Operating expense growth month over month (%). Tracking your expenses month over month is the best way to see spending trends and measure goals. Set a maximum monthly percentage growth for your operating costs.

KPI summary
Key performance indicators give your company a tangible way to see if you are thriving or flailing. The more real data you can give your CFO and accounting team, the better their analysis will be.
So, are you confident in your KPIs and financial reporting? If you’re not quite sure where to start, a discovery call is a good place to begin.
About this guide
Written by The Visory Team. Published . General information for US businesses, not advice for your situation.